Todas las noticias del acontecer nacional de la República Dominicana y el resto del mundo.

www.elcaribe.com.do
The pressure on the Government is intense and growing. It has been 40 days since President Medina announced a series of social distancing measures that included the pause in operations of companies from most economic sectors and the sending to their homes of more than 3 million workers. The Government has sought resources down to the stones to make cash transfers to most of the workers who have been asked to stay home. When this request takes place in democratic regimes and economies with high informality, it is difficult to keep people and their economy in prolonged quarantine.
Nobody, absolutely nobody in the country, would like to reopen the economy more than President Medina. First, because the longer the transitional cessation of activities lasts, the greater the erosion of economic growth and the less the reduction of poverty. But also, because the more the pause is extended, the lower the collections and the greater the requirements of public indebtedness to finance a fiscal deficit that will increase due to the lower collection and the greater expense necessary so that millions of Dominicans can count on income that allows them survive the effects of the pandemic.
So why don't you just reopen? Because the President is a responsible, sensitive and humane statesman. Like most governments in the world, the Dominican Republic is monitoring pandemic propagation models on a daily basis, specifically, the one developed by Kermarck and McKendrick in 1927, better known as the SIR (Susceptible-Infected-Removed) model and which Last April 17, Raúl Ovalle, Vicente de Peña and Francisco Ramírez, three brilliant Dominican economists, used their paper “COVID-19 in the Dominican Republic: We declared war, but… are we winning?”.
This is the most widely used model for evaluating the impact that social distancing policies have on flattening the contagion curve. The structure is simple. First, it assumes that the 10,403,410 Dominicans are susceptible (S) to contract the virus (as of today we don't really know if this is the case; there may be genetically immune people). From there, the narrative is as follows. The first verse says that the number of susceptibles (S) at time “t” drops at a rate of speed that will depend on the probability that a susceptible person will come into effective contact with an infected person. Who is responsible for the contact being "effective", that is, that the infected person "sticks" the virus to the susceptible? Mr. Beta (β). This agent is more likely to achieve its objective of infecting "all the susceptible" the greater the average number of "encounters" that occur between susceptible and infected, and the more transmissible the virus is. Beta loses patience when the hug between a susceptible and an infected replicates the hug of two astronauts in space.
The second verse reveals that the number of active infected increases with the effectiveness of Mr. Beta's work and decreases with Mrs. Gamma (γ), which represents the growth rate of the infected infected (those who recovered and those who died). Since, in the case of coronavirus, the average of the virus incubation period is 14 days, the Gamma value is constant (1/14 days = 0.07142 days). Finally, the model closes with the following verse: the number of removals from day “t” (recovered plus deceased) will be equal to the product of Gamma (γ) and the number of active infected at time “t”. Mathematicians and economists formalize the previous three verses into a system of three differential equations, which we are not going to list here.
For epidemiologists, the key parameter to be determined by the model is the basic reproduction number (Ro), that is, the average number of secondary infections that a new infected person produces. As long as Ro is greater than unity, the epidemic will continue to expand; only when Ro is less than unity will it begin to dissipate. Operating the model, it can be deduced that Ro = β / γ for each susceptible that becomes infected. According to Wu et al, “Nowcasting and Forecasting the Potential Domestic and International Spread of the 2019-nCoV Outbreak Originating in Wuhan, China: a Modeling Study” (The Lancet, Feb. 29, 2020), in the absence of social distancing measures, the basic breeding number of the coronavirus in China was found to be Ro = 2.68, yielding an effective contact rate (β) of 0.19.
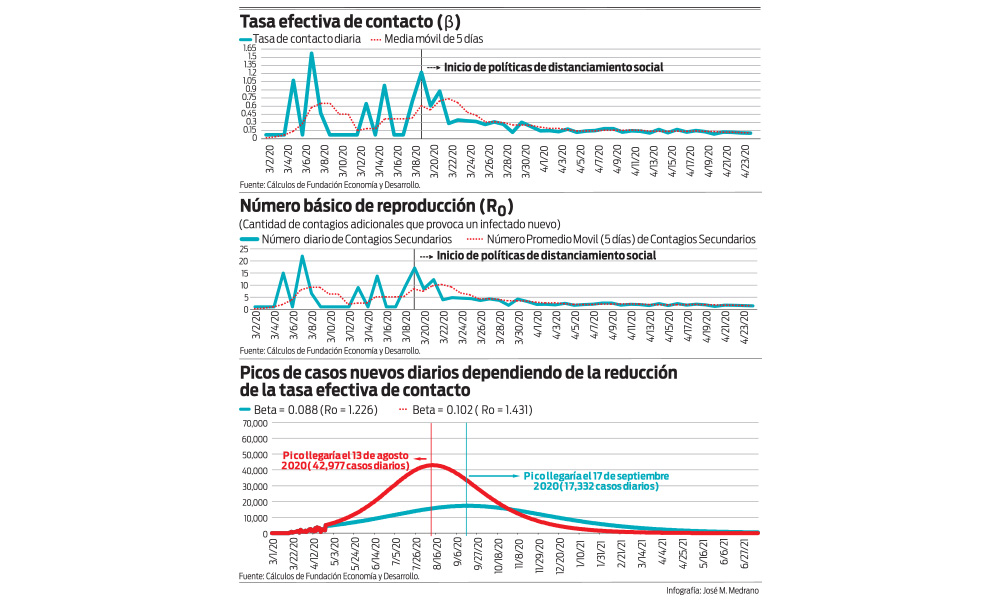
The information provided daily by the Ministry of Public Health allows calculating the value of the effective contact rate or contagion rate (β) and the basic number of reproduction (Ro) on a daily basis. In the first graph, we present the daily evolution and the 5-day moving average of the effective contact rate (β) in the Dominican Republic during the period March 2 - April 24, 2020. The green vertical line shows what was coming. taking place before President Danilo Medina's speech on March 18 when he announced the country's social distancing measures and what happened after the announcement of those measures. Between March 2 and March 18, the effective contact rate averaged 0.366, registering a level of 1,218 the day before the measures came into effect. With such a β, no one should be surprised that the basic reproduction number (Ro) of the coronavirus during the period 2 - 18 March averaged 5.12, practically double that estimated by Wu et al for China. The day President Medina announced the social distancing measures, the Ro had reached 9.7. He did not announce them before so as not to alarm the population days before the municipal elections.
What have we observed after the social distancing measures began to be implemented as of March 19? The measures have had and are aimed at reducing mobility and contact and thus subtracting momentum and speed from the effective contact rate (β). In the first graph it can be seen how the level of β has been falling from 0.69 that it registered on March 18 to 0.102 on April 24. Social distancing measures have reduced the effective contact rate, which has allowed the basic number of virus reproduction (Ro) to drop from 9.66 on March 18 to 1.43 on April 24. The second graph shows this dynamic.
Can we sing victory? Ovalle, de Peña and Ramírez, aware that with a 5-day moving average of the basic number of reproduction (Ro) in the neighborhood of 1.50, the pandemic will continue to expand, they urge not to sing it yet and even recommend strengthening and extending the measures current social distancing.
We all know that the Kermarck and McKendrick model that we have been describing is a typical example of "toy models" that often need to be modified in order to more accurately predict "reality". Let's forget the above for a moment and play with the model to determine when the peak in the number of new daily cases would take place, the variable that the Ministry of Public Health publishes in its bulletins daily. We make the caveat that this variable is different from the increase in the number of active infected (I) in the SIR model; remember that the latter deduces from the new daily cases those that are removed that day, because they recovered or died.
We are going to assume, for a first simulation, that the basic reproduction number (Ro) of last April 24, 1,431, remains unchanged and does not drop any further. In this scenario, the model predicts that the peak of new daily cases would be reached on August 13 of this year, with a total of 42,997 new daily cases. In early May 2021, 5.7 million Dominicans, equivalent to 55% of the population, would have been infected. Let no one tear their clothes. Merkel, using a similar model, stated on March 12 that the coronavirus could end up infecting up to 70% of Germans. A month earlier, Professor at the Harvard University School of Public Health, Marc Lipsitch,
If the government, following the recommendations of Ovalle, de Peña and Ramírez, strengthens and extends the current measures of social distancing and thereby manages to further reduce the effective contact rate (β) and, consequently, the basic number of reproduction ( Ro) fell, for a second simulation, to 1,226, the model predicts that the peak of new daily cases would be reached on September 17, 2020, with a total of 17,332 new daily cases. At the end of August 2021, 37% of the Dominican population would have been infected by the coronavirus.
I am sure that most of those who are reading this article, must be thinking that I have lost my mind doing simulations with a model that does not even come to foolishness.
I would perfectly understand the reaction. The research team of the Fundación Economía y Desarrollo, some of the authors of the article by Ovalle, de Peña and Ramírez, and the undersigned, using Microsoft Teams so as not to affect (β), reviewed the results over and over again and confirmed that these they are what generates the model. Can we affirm that the model is nonsense because it distances itself exorbitantly from "reality"?