
- Thread starter MikeFisher
- Start date
You are using an out of date browser. It may not display this or other websites correctly.
You should upgrade or use an alternative browser.
You should upgrade or use an alternative browser.
2013, the Storms and the Fisherman in Paradise
- Status
- Not open for further replies.
Stormwise it looks clear around the Isle for this weekend and the coming week.
the models do not expect cyclonic activities before end of next week, the hotspots are the Gulf of Mexico and the Western Caribbean Sea, so the southshores more than here on the far East.
been in santo domingo this morning, watching the caribbean Sea on my way, looks very nasty and dirty, the sign for a heck of rain that lately came down over the central mountains and the southern shores, so the rivers bring all that dirt down to the Sea, while here on the East nothing happened, the usual nighttime downpours, but nothing else.
Mike
since today the Map of the national hurricane center is up and running again, from june 1st to november 30th 2013.
the first sytem of the Atlantic Basin of the 2013 season is the remaints of former Paqcific Hurricane Barbara, which crossed Mexico and is located in the southern gulf of mexico in the Bay of Campeche.
here i copy the Map, which will autoupdate every 6hrs.
Mike

the first sytem of the Atlantic Basin of the 2013 season is the remaints of former Paqcific Hurricane Barbara, which crossed Mexico and is located in the southern gulf of mexico in the Bay of Campeche.
here i copy the Map, which will autoupdate every 6hrs.
Mike
as awaited the early season activity starts in the western Caribbean Sea/Gulf of Mexico regions.
since this morning we have the first caribbean disturbance up, located in the northwestern caribbean sea, walking slowly towards the Yucatan channel. chances for development are near zero, conditions are unfavorable in the area.
the western caribbean sea and the southern gulf of mexico are actually the only areas where Disturbances can be expected to pop up.
we are nice clear around our Island, here on the East we can await to pass all day long under blue clear skies with a low wind of just 5-7 knots out of the ESE'ern direction, gusts may reach 10 knots, all is quiet and ready for a perfect beachday here.
Mike
our SAL(the dry Saharan Airmasses which hinder/bother storms to grow up/develop quick) is this season's beginning well down, the African Coastline is spawning watermasses out on the Atlantic, moisturing da Highway between Cap Verde and the Caribbean Islands. Seasurface temperatures are all around on the high side of the Stats, Windshear East of Us is in the mid-low range only and forecasted to stay down for the next days(the WS forecasts are not any reliable more than 3-4 days in advance). the same for the Caribbean Sea, moistured and very high Sea Surface Temps.
Mike
Mike
nothing for our own hometurf, so let's show what's around elsewhere within the Atlantic Basin.
as awaited the first system came up well west of Hispaniola, it formed in the western caribbean sea and moves into the gulf of mexico.
designated Invest 91L, the first system of the Season for our region, is slowly moving northwards and will most likely not become a Storm, it may become a TD by Thursday as the max by the actual present conditions.
but as so often, it is not the windpowers which are the big threat, it is the waterloads, and that's what is plentiful available in that system, Yucatan/Western Cuba and Southern Florida can expect up to 8 inches of watering during the next 3-4 days. a significant percentage of the System's Moisture been fed by formerly Pacific Cyclone Barbara, which left it's wet remaints over the Bay of Campeche in the souther Gulf, 91L just su.cked it up.
nothing bad to await for our Island for the next days
Mike
all clear around Paradise Island.
invest 91L shows a bit or organization and seems to run by the shedule i showed on monday.
it may become for a very short timeframe a TD later tomorrow/thursday, and will then walk over northern Florida, along coastal North Carolina and into Massachusets friday night/early sat morning. due not very favourable surrounding conditions on it's way for the next couple days the system has very short time frames to intensify into a storm/Tropical or Extratropical Storm, i see it very unlikely that it contains Tropical Storm powers when walking Massachusets, but it is a slight possibility. the system is small and built weak and unorganized, so even if it reaches the Name Status it will be for a short while, once over land it will go down quick, is is nothing of a resisting powerforce. until now it does not show any powers that would bring bad weather conditions over here to us as a result of 91L.
looks all good for Hispaniola for the next days
Mike
Tropical Storm Andrea is up in the Gulf of Mexico, surprisingl?y quick considering the surroundinh conditions, very quick.
she is drifting northwards on no more than 3 mphr speed, so she will get some extra hours over water to intensify before walking Land.
Mike
she is drifting northwards on no more than 3 mphr speed, so she will get some extra hours over water to intensify before walking Land.
Mike

TS Andrea grew despite high windshear, dry air and expected unorganzed structure very well, in size and on her powers.
latest data is from a Hurricane Hunter flight at 3AM last night and there will not be much updates before the next flight sheduled for 3PM this afternoon. landfall is expected for early evening today. she can be expected to run on the border of a strong TS/Weak Cat1 Cuclone on Landfall.
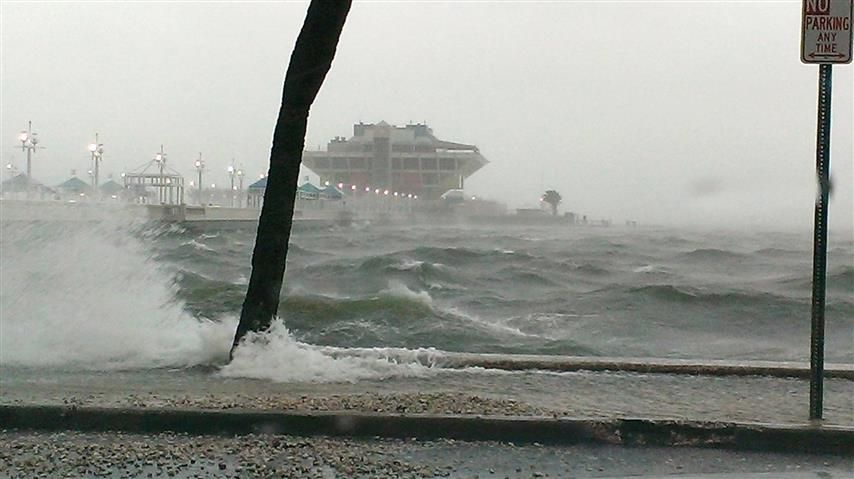
this morning Florida faced a number of Tornadoes from Fort Lauderdale to Tampa Bay, with the Tampa Bay area the most prone to the buggers, there are several more to come during today, Florida will stay under Tornado alert for the whole day today.
the mainthreat of Andrea is her heavy rains which will continue for at least 36 more hours.
all quiet around our own Island and nothing expected to come up for the next days.
Mike
latest data is from a Hurricane Hunter flight at 3AM last night and there will not be much updates before the next flight sheduled for 3PM this afternoon. landfall is expected for early evening today. she can be expected to run on the border of a strong TS/Weak Cat1 Cuclone on Landfall.
this morning Florida faced a number of Tornadoes from Fort Lauderdale to Tampa Bay, with the Tampa Bay area the most prone to the buggers, there are several more to come during today, Florida will stay under Tornado alert for the whole day today.
the mainthreat of Andrea is her heavy rains which will continue for at least 36 more hours.
all quiet around our own Island and nothing expected to come up for the next days.
Mike
and the tropical wave present in front of our homedoor since last night is now marked a area of disturbed weather.
located just a good 800 miles east of the Islands, it is under actually not favorable surrounding conditions.
we will see how it develops in the next 24hrs.
Mike
located just a good 800 miles east of the Islands, it is under actually not favorable surrounding conditions.
we will see how it develops in the next 24hrs.
Mike

it is on one side a early stage, even named invest92L, but with nothing shown, and yes, on the other hand it is just a 800miles east of my homedoor and could start to influence the surf of the homebeach within 48hrs easily, If it develops and takes a course to the Islands.
right now, a outlook that could change quickly of course,
i see it as a area of disturbed weather interacting with a weak tropical wave, the actual windpatterns would move it far northeast of the islands out into the graveyard, developed or not, but on such early stage the patterns can change by the hour, not worth to think too far ahead of time.
by tomorrow afternoon it may show some face with the cards mixed newly.
in case it develops to a Storm and takes a walk to our soil we would have a window of maybe 24hrs before significant influence is present on the spot, thats the max we could get on the small quick upcoming disturbed areas right in front of the door, If they develop.
actual conditions do not favor such, but they didn't on 91L neither and that went into a TS Andrea quick.
we will watch and take life as it is at a time.
how has the Sea been up north on yoru grounds today? we had down here a sunny beachday but for offshore conditions we have for the 2nd day some nasty gusting windies around, nothing dangerous, but nothing normal neither.
Mike
i took a closer look on the bugger 92L.
weird,
i don't give it a chance to develop into a storm under the actual highest windshear which shows on the forecast to stay on for the whole coming weekend(gets very unreliable over 3 days ahead of time),
but on the other side the Tropical wave looks well organized, despite harsh surrounding conditions, it has a clear steady Spin on.
even without development, walking towards the Islands it would be a no named nothing bring stronmg rainfalls under heavy windies to the northern Antilles Islands.
we will see tomorrow noon if that organization and spin stay up and may run a plan.
Mike
NOAA gives it a near nothing(10%) chance of becoming a tropical cyclone during the next 48hrs,
Heck, in 48hrs it's winds and rains would be right over the northern Islands as it is right now just around 750 miles East and walking straight westwards ho on a good 15 miles per hour.
i love da **** off the limits of da books.
Mike
Heck, in 48hrs it's winds and rains would be right over the northern Islands as it is right now just around 750 miles East and walking straight westwards ho on a good 15 miles per hour.
i love da **** off the limits of da books.
Mike
the first chart shows the Sea Surface Temperatures on the full world map,
the 2nd map is a cut of our area of interest, the Caribbean Sea, Gulf of Mexico, Bahamas and the northamerican Eastshores.
while the US just finished one of the coolest Aprils since a very long time, the Ocean's Surface shows the opposite, it is early in the year very hot and such usually promises a heck of activity out there, when colder airportions hit the hotzones over those hot waters. as opposed to the cold temps over the mainland, the waters off the US Eastshores up to New York show very high Sea Surface Temps. it would be unusual for that area, but such combination hides the danger of early season quick and nearshore uppopping formations near the coast, when cooler air from the mainland heads off over the Ocean.
all our Highway from the West African Cap Verde Islands, where the big Boys and Gals are born, over here to the Caribbean Islands, including most of the Caribbean Sea, the Gulf of Mexico and the SE shores of the US, all those areas are actually on very hot SST conditions, means the conditions are ready to rumble.


The water temp in the DR looks like it is as warm as fort lauderdale and there is a huge difference....something wrong here
Robert!!!
at least here on da weather threat it should be allowed to type **** without it showing up as ****
lol
Mike
at least here on da weather threat it should be allowed to type **** without it showing up as ****
lol
Mike
- Status
- Not open for further replies.